I understand how important it is for businesses to ensure that their systems run smoothly with no hindrance.
I also understand that Monitoring various aspects of your IT infrastructure can be a bit of a headache if not done correctly.
That’s why I am writing this blog to tell you about the best open-source monitoring tools.
Whether the organization is big or small, as a manager, you cannot afford to ignore the need for effective monitoring tools. Your servers, networks, and overall infrastructure need to be protected.
In this blog, I will talk about modern cloud and on-premise solutions. There are the best open source monitoring tools available to make your professional life easier.
DevOps users must focus on monitoring and observability to track their team’s performance. I’ve been a project head for several years now, and I know how important open-source monitoring tools are in DevOps.
A big online business deals with millions of user requests per second. It can be quite a challenge to manage and track all of those requests.
But don’t worry, there are some amazing server monitoring open source tools out there that can make your work easier and more efficient.
Let me take you on a journey to explore the best open-source monitoring tools that I’ve come across. These tools will help you keep an eye on your systems and ensure that everything is secure and stable.
Unlock exclusive savings on web hosting with ChemiCloud Coupon! Get reliable hosting services at unbeatable prices today.
Best Open Source Monitoring Tools
Now, I am going to talk about the best open-source monitoring tools list. I have mentioned all the features and provided an honest review based on my experience. Let’s dive in!
Prometheus
Prometheus is an amazing open-source monitoring solution that I have been using for many years. This software gathers and analyzes data to keep track of how things change over time.

Prometheus provides its own set of tools to help you set up monitoring. This becomes a great help for developers who work in environments where things are containerized, like Kubernetes.
If you like a similar environment, then Prometheus is your go-to choice. Also, I must admit that this software is one of the most reliable monitoring tools open source around.
Prometheus can gather all sorts of metrics from servers, Kubernetes, and various devices. It uses an open source SNMP monitor, SNMP pings to check on things, and keeps an eye on the network bandwidth being used from the device’s perspective. x
Simple Network Management Protocol (SNMP) is a really popular and widely used tool for network monitoring. I recently saw a new feature of Prometheus called PromQL that helps analyze the data it collects.
With PromQL, I can make Prometheus create all sorts of useful things like plots, tables, and graphics to help me understand what’s going on with the systems it’s monitoring.
Another amazing feature of Prometheus is the alert manager. It’s like the guardian of alerts because it takes care of alerting based on the rules I set up in Prometheus.
Whenever something goes wrong, it lets me know right away.
Prometheus can collect metrics from anywhere. It covers everything like system metrics, metrics from applications, or the latest metrics from containerized applications.
When it comes to collaboration, Prometheus is really good at it.
I find this software to be coming along with Grafana, which is like the dashboard that helps me visualize all those metrics. Grafana is one of the best open-source monitoring dashboards out there.
Features:
- Highly efficient and advanced data dimensional mode
- Series of key-value pairs
- Users extract and manage data
- Generate graphs and charts
- An inbuilt browser: Grafana
- Integration with Grafana
- Console template
- Store your time series
- Functional sharing
- Highly reliable
- Provides local storage
- Static allocation
- Provides notifications
- Manages database updates
- Dimensional information
Pros:
- Uses open-source principles.
- Offers multiple integration possibilities.
Cons:
- May pose a complexity hurdle for beginners.
Zabbix
Zabbix is the guardian of server information, helping me manage it efficiently and generate secure analytics reports.

It’s packed with some amazing features, like multiple integrations that can automate a bunch of tasks. If you have a busy schedule, I suggest you try this software.
One thing I appreciate about Zabbix is its deployment technique. It’s a careful server caretaker that makes sure that there is no chance of a crash when code is deployed.
Zabbix has literally saved me from the issue of server crashes every time.
Zabbix never compromises when it comes to security. It provides a secure network for sharing information directly with the server. I no longer worry about data breaches.
Zabbix is a professionally developed open-source monitoring platform that’s super useful for businesses in all kinds of fields.
It’s got an easy-to-use interface that lets me keep an eye on millions of metrics in real-time. These metrics come from all sorts of sources, like network devices and virtual machines.
It keeps all my data in one centralized system, and I can analyze and visualize all those metrics and stats in one place. If something goes wrong, Zabbix alerts me or sends me a notification.
The versatility of Zabbix is amazing. I don’t just use this for servers, rather it’s great for monitoring networks, applications, and services as well.
It even has auto-discover functionality to find issues. Plus, it can do automated metric collections and distributed monitoring. It’s a big help when you’re dealing with a lot of different systems.
Zabbix is free software and a good fit for everyone, whether you’re in education, healthcare, government, marketing, banking, or any other industry.
Features:
- Transparent view of the network and architecture
- Extract server information
- Separate dashboard
- Different cloud monitoring features.
- Manage metrics
- Record all the data
- Detect issues with the server
- Support tips to fix the issues
- Advanced alerting feature
- Charts and report features visualize data
- A pane of glass feature
- Advanced business monitor feature
Pros:
- Effective power detection capabilities.
- Robust metrics metering features.
Cons:
- Lacks the ability to offer architectural insights.
Pricing:
- Free Trial
- Advanced $18,700/year
- Professional $27,000/year
- Expert $43,900/year
Nagios
Nagios is my third eye for the entire team for mentoring purposes. Let me tell you how I have used Nagios in my career as a Project head. Nagios is a free and open-source computer tool for monitoring systems, networks, and infrastructure.

It does everything, from sorting log data to analyzing my bandwidth. The reliability of this software helps you make smart business decisions.
It’s an impressive number that Nagios is trusted by over 9000 top customers like Airbnb, Cisco, and Paypal.
The huge number of customers shows that it offers a range of products and services that suit everyone from small businesses to large enterprises.
Nagoios can keep an eye on servers, and applications, and make your network visibility better. It’s super flexible and can easily integrate with your existing systems.
It offers various software packages like Nagios Core, Nagios XI, Nagios Fusion, and Nagios Log Server.
Nagios Core quickly monitors your IT infrastructure. The Log Server is a handy tool for viewing, analyzing, and archiving logs from different sources.
I always rely on the network analyzer to track Network bandwidth. Nagios Fusion is like your central hub for checking the operational status and solving network-wide problems faster.
I took Nagios Fusion for 30 30-day free trial. Nagios offers both paid and open-source versions. If you’re looking for a solid monitoring solution, Nagios is definitely worth considering.
Features
- Alerting and notifications
- Customizable dashboard
- Historical data analysis
- Plugin ecosystem
- Distributed monitoring and load balancing
Pricing
Nagios has a free and open-source license edition. But it also has other pricing plans that include:
- Free trial
- Number of nodes
- (100,200,300,400,500 nodes) starts at $1995
- Unlimited node license $19,995
- Instance
- Starts at $3995
- 20+ instance license- contact sales
- Phone Support
- 5 calls $1,995
- 10 calls $2,995
- Standard Edition: $1995/one time-license
- Enterprise Edition: $3495/one time-license
Pros:
- Seamlessly integrates with various platforms.
- Offers a cost-effective monitoring solution.
- Benefits from an engaged user community with a wealth of knowledge.
- Allows extensive customization to meet specific monitoring requirements.
Cons:
- Demands proficient technical expertise for installation.
- Presents a steep learning curve for novice users.
- Provides limited graphical data visualization options.
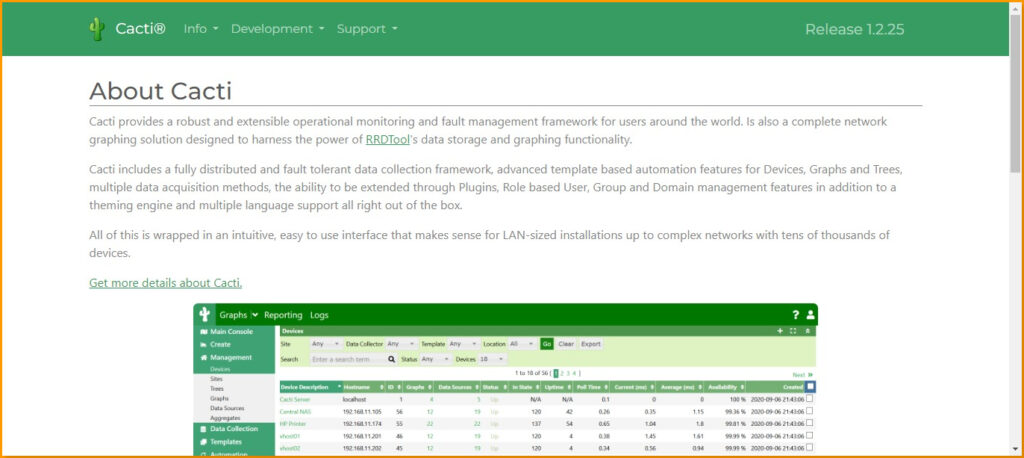
Cacti
Cacti is one of the most popular open-source monitoring tools out there. This software allows me to personalize my dashboard and servers to match my specific needs.
It’s like having a personal IT setup to make sure everything fits just right.
What’s really neat about Cacti is that it allows me to add multiple plugins, data managers, and frameworks to my network. It has everything that I need to keep my network running smoothly.
Cacti is quite user-friendly as it has role-based user and domain management features. These features help me set up different user roles and themes for my dashboard.
It allows me to customize the experience to suit the preferences of different team members. It’s a web-based networking monitoring tool, and I can easily generate graphs that show relevant network data.
What I really like about it is that it presents network statistics in a way that’s easy to understand.
The charts and graphs of Cacti are very well-defined which helps me to keep track of what’s happening in my network.
Features:
- Fault management framework
- Network graphing solution
- Advanced graphs with RRD tool data storage
- Fault-free data collection framework
- Advanced automated templates
- Multiple data acquisition methods
- Series of plugins
Pricing: Free
Pros:
- Provides the flexibility of customizable templates.
- Benefits from an active and helpful community of users.
- Boasts excellent historical data analysis functionality.
- Offers extensive graphing capabilities for data visualization.
Cons:
- Configuration may be time-consuming.
- Lacks real-time monitoring capabilities.
- Presents a challenging learning curve for beginners.
Observium
Observium watches over your server’s traffic which helps in enhancing the quality of your work.
It uses API integration to make your job easier along with other tools like IP SLA, Pseudowire, and class-based QoS metrics.
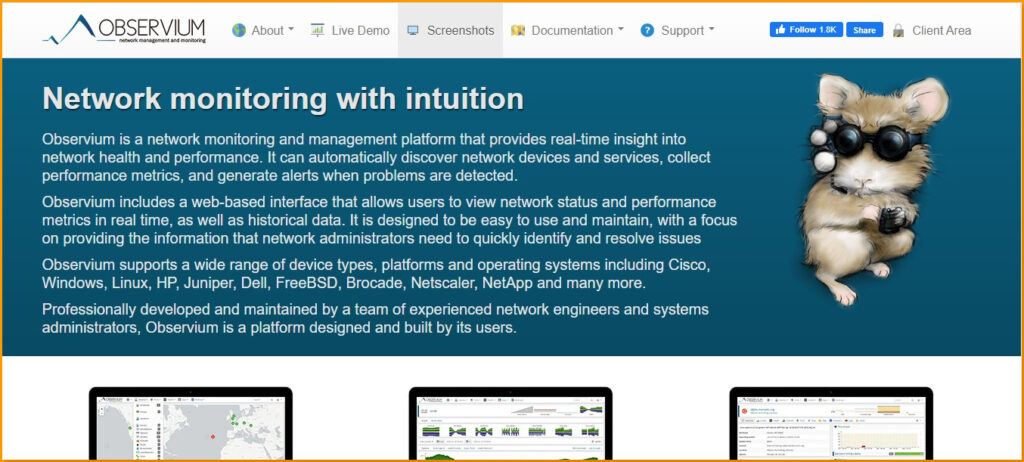
Observium is one of the best software for network monitoring and management. It gives me a clear view of my company’s infrastructure.
It is suitable for all kinds of companies, no matter their size. It’s reliable, user-friendly, and supports a wide range of devices.
A lot of big companies trust Observium when it comes to monitoring. Firms like governments, major corporations, telecommunications companies, ISPs, and more use this software.
Even small to medium-sized businesses have found it to be a valuable tool. Some other popular names that are a part of Observium’s user base include Twitch, eBay, and PayPal.
Observium simplifies network management for my easy understanding. It keeps an eye on performance metrics and notifies me when it spots issues.
It automatically detects network devices and services, saving me a lot of time. It’s an amazing option when you are dealing with a lot of devices.
Observium lets me configure thresholds and failure states, so I can set up alerts for different things that matter to me. It offers a web interface that is super user-friendly.
Regardless of whether you are technically challenged, you can easily read all the results and alerts from Observium.
Observium works with a wide range of hardware, software, and operating systems. Whether you’re using Cisco, Windows, Linux, or a bunch of other systems, Observium has got you covered.
There are different versions of Observium, like the Enterprise, Professional, and Community Editions. The Community Edition is free, so you can give it a try without any cost.
Features:
- Real-time updates
- Unlimited monitored devices, sensors, and ports
- Work with multiple devices
- Full auto-discovery feature
- Network mapping
- Advanced alerting feature
- Threshold altering.
- Traffic accounting system
Pricing:
- Free
- Professional $280/year
- Enterprise $1400/year
Pros:
- Facilitates the visualization of distributed networks.
- Efficiently organizes capacity and disaster recovery planning.
- Features a powerful yet user-friendly and intuitive interface.
- Automates the collection and display of service information.
Cons:
- Involves a complex initial setup process.
- Offers limited reporting capabilities.
- Lacks a variety of integration options.
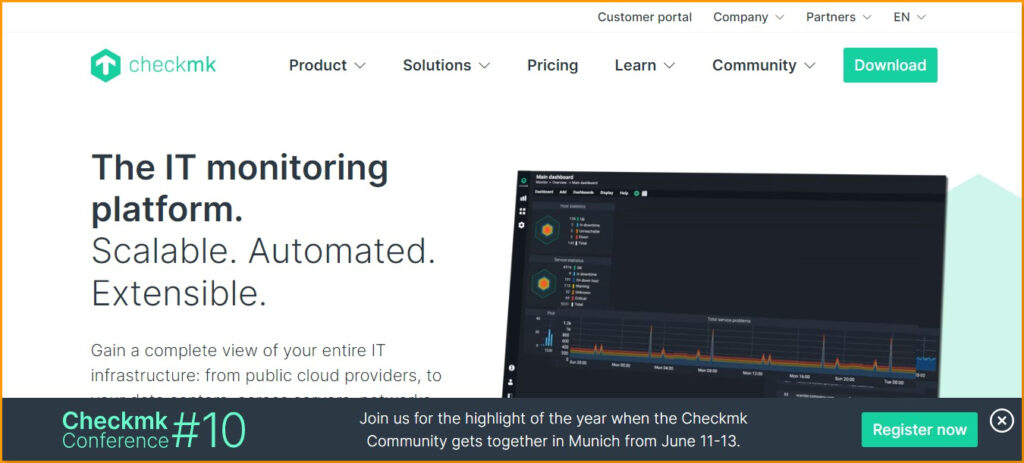
Checkmk
In the beginning stage of my career, I used to work with Checkmk. I liked it enough as it has some awesome features that make my work a lot easier.
An amazing feature is the auto-discovery, which helps me find devices in nearby areas. This means I don’t have to search for them manually.
Checkmk also has auto-configuration and automated agent updates, which means I can automate basic tasks.
This is a big help because it saves me from doing repetitive work. It can automatically monitor different infrastructures, even if they’re always changing or temporary.
It has a powerful API integration with systems like ITOM, and dynamic dashboards that keep me updated all the time.
The latest version of this software is Checkmk 2.1 which has improved monitoring for Kubernetes, more integrations for open observability, better performance, and lots of other great stuff.
Checkmk comes in two versions: Raw and Enterprises. The Raw edition is open source and free, and it checks the health of servers, networks, and applications.
And the Enterprise edition has more features with some amount to pay for.
This software monitor tool supports automatic network discovery and keeps track of all the hardware and software. Checkmk supports over 2000 plugins that provide amazing functionality.
I can even create my own using its API, allowing me to customize it to fit my needs. Checkmk can handle complex and hybrid IT environments.
Features:
- Rapid deployment
- Faster server
- All reports in less time
- Quick installation
- Auto-discovery feature
- Alarms to alert you
- Increase scalability of product/business.
- Multiple server hosts
- Instance modulation
- Minimal requirements
- Automation feature
This is a handy tool with a series of features that make automation much easier for you, and this tool has considerable pricing.
Pricing:
- Standard $904/year (including tax)
- Standard Group $1773.10/year (including tax)
- Managed Services $1773.10/year(including tax)
Pros:
- Accommodates the evolving needs of small businesses and large enterprises.
- Easy customization of dashboards.
- Proactive monitoring for issue identification and resolution.
- A centralized monitoring console provides a holistic view of the entire infrastructure.
Cons:
- Complex initial configuration.
- Continuous maintenance is required.
- The learning curve for advanced features.
Comparison Table of Best Open-source Server Monitoring Tools
| Name | Best For | Pricing | Special feature | |
| Prometheus | Manage data extraction from server | Free | Alerts and data management | |
| Zabbix | Advanced Security | Manage data extraction from the server | Power detection | |
| Nagios | Multiple OS monitoring | Free trialNumber of nodesStarts at $1,995InstanceStarts at $3,995Phone SupportStarts at $1995 | Expendable Architecture | |
| Observium | Traffic monitoring and management | Free TrialAdvanced $18,700/year professional $27,000/yearExpert $43,900/year | Traffic monitoring and management | |
| Checkmk | Powerful automation tool | Standard $904/year (including tax)Standard Group $1773.10/year (including tax)Managed Services $1773.10/year(including tax) | Powerful automation tool |
What are Open Source Monitoring Tools?
Open-source monitoring tools are handy applications that can look at the traffic on a server and then create reports based on what they find.
This makes it easy for me to understand what’s going on with my server with all the important data in front of me.
These open-source monitoring tools can go through the entire server and check every line of code and data. By doing this, the tools can find any bugs or issues in the open source server monitoring.
The best part is that they provide me with suggestions on how to fix them.
These tools also keep an eye on the data being shared on the server and keep track of logs. This helps to improve the security of the server, which is really important as I explore the best websites for learning coding.
I can rest easy knowing that my data is being protected.
Another cool feature is that these applications help me check for crashes and respond to service requests. With the help of these tools, I can make sure that everything is working as smoothly as it should.
What are the Benefits of Open Source Monitoring Tools?
Below, I am providing the benefits of Open Source Monitoring tools:
- I can customize it according to my specific needs.
- I have the freedom to modify the software’s source code, add or remove features, and create personalized dashboards and reports.
- Foster rapid innovation.
- An amazing community of contributors continuously enhances them with new features and approaches.
- This allows me to stay up-to-date with the latest monitoring technologies.
- Easy adaptation to emerging trends in network analysis.
- These tools provide long-term sustainability.
- The community can maintain and improve the technology, preventing any disruptions in my monitoring capabilities.
- It has helped me in my career development.
- I can develop my technical skills, gain real-world experience, and stay updated with the latest advancements in monitoring technology.
- You can use these to meet the unique monitoring requirements of different organizations and industries.
- Open-source monitoring tools can handle infrastructure, applications, security, or industry compliance.
- The transparent data handling of open-source monitoring tools is important to me.
- I can easily understand and manage data collection, storage, and processing.
- It helps me comply with privacy and security regulations.
- This transparency ensures that sensitive information is handled correctly.
Conclusion
Hopefully, this guide on the best open source monitoring tools has helped you in getting to know all the basic and advanced things that a monitoring tool does.
I have talked about what a monitoring tool does and the benefits that I have experienced. Above, I have mentioned all the features, pros, and cons of the best monitoring tools that you can refer to.
If you own a business, then you must carefully assess your unique needs, resources, and the learning curve that your team can manage.
What I have felt so far is that the best open-source monitoring tool is one that aligns with an organization’s goals. It must promote proactive issue detection and resolution.
The above-mentioned are some of the most common Open Source Monitoring softwares used for network monitoring and for helpful assistants that identify the issues and help to fix them, in the system we’re using.
They should also focus on IT teams to maintain and optimize their infrastructure effectively.
Good luck with your best open-source monitoring tool hunt!!!
References:
- https://community.soundcore.com/t/masterclass-coupon-discount-code-2024-save-10-now/9421083
- https://skillsharecouponcode.weebly.com/
- https://chodilinh.com/threads/skillshare-discount-code.262077/
- https://skillshare-coupon-code.hashnode.dev/exclusive-skillshare-discount-code-for-2024
- https://medium.com/@keertiumesh25/latest-skillshare-discount-codes-for-2024-85847db48336
- https://seo-powersuite-coupons.weebly.com/
- https://www.geocities.ws/seopowersuitecouponcode/
- https://hackmd.io/@nzjow69/seo-powersuite-discount
- https://medium.com/@keertiumesh25/seo-powersuite-discount-2024-save-up-to-34-a784c918cd64
- https://web-hosting-coupon.hashnode.dev/seo-powersuite-discount
- https://community.soundcore.com/t/seo-powersuite-discount-coupons-2024-save-297/9409286
- https://seo-powersuite-oupon.mystrikingly.com/
- https://narede.clicrbs.com.br/articles/seo-powersuite-coupon-code-2024
- https://start.me/p/zpa6zM
- https://edx-coupon-code.weebly.com/
- https://www.geocities.ws/edx-coupon-code/
- https://anil.podia.com/edx-free-trial
- https://web-hosting-coupon.hashnode.dev/edx-coupon-codes
- https://gravatar.com/edxpromocode
- https://start.me/p/80vLGa/edx-coupons
- https://edx-review.bandcamp.com/album/edx-review-what-is-edx-is-edx-legit-2024
- https://x.com/ijasonwalker/status/1801245686786130127
- https://pin.it/7fdTB03Vf
- https://gravatar.com/teachablecouponcode?utm_source=share_profile
- https://medium.com/@keertiumesh25/teachable-coupon-code-2024-84c4324861a2
- https://community.soundcore.com/t/jungle-scout-discount-code-2024-claim-80-off-now/9409342
- https://gitlab.aicrowd.com/-/snippets/188553
- https://web-hosting-coupon.hashnode.dev/oceanwp-free-trial
- https://anil.podia.com/hello-theme-vs-oceanwp
- https://oceanwp-theme-review.weebly.com/
- https://linktr.ee/oceanwp_coupons
- https://web-hosting-coupon.hashnode.dev/oceanwp-coupon-code
- https://community.soundcore.com/t/oceanwp-coupon-codes-discounts-get-50-off-2024/9409285
- https://pressable-coupons.hashnode.dev/pressable-review
- https://pressable-pricing.weebly.com/
- https://community.soundcore.com/t/pressable-coupon-code-50-off-promo-codes-march-2024/9416076
- https://pressable-vs-wpengine.mystrikingly.com/
- https://web-hosting-coupons.bandcamp.com/album/pressable-coupon-code
- https://start.me/p/BPNkvv/pressable-coupon-code
- https://anil.podia.com/pressable-vs-touchableopacity
- https://gitlab.aicrowd.com/-/snippets/182020
- https://www.geocities.ws/kodekloud-coupon-codes/
- https://kodekloud-coupon-code.weebly.com/
- https://twitter.com/KeertiUmesh/status/1790766579078099125
- https://web-hosting-coupon.hashnode.dev/kodekloud-coupons
- https://community.soundcore.com/t/kodekloud-coupons-promo-codes-march-2024-save-45-now/9406334
- https://www.geocities.ws/dreamhost-pricing/
- https://gitlab.aicrowd.com/-/snippets/149613
- https://web-hosting-coupon.hashnode.dev/dreamhost-coupons
- https://anil.podia.com/dreamhost-affiliate-program
- https://web-hosting-coupons.bandcamp.com/album/dreamhost-review-2024
- https://dreamhost-free-trial.mystrikingly.com/
- https://web-hosting-coupon.hashnode.dev/bluehost-free-trial
- https://community.soundcore.com/t/bluehost-free-trial-2024-get-hosting-for-30-days-at-zero/9411832
- https://anil.podia.com/whizlabs-review
- https://gitlab.aicrowd.com/-/snippets/184026
- https://heylink.me/whizlabscoupons/
- https://web-hosting-coupon.hashnode.dev/whizlabs-coupon
- https://whizlabs-student-discount.mystrikingly.com/
- https://web-hosting-coupons.bandcamp.com/album/whizlabs-discount-code-2024
- https://www.ticketleap.events/tickets/whizlabs-coupon-code/discounts
- https://start.me/p/Mb8dvR/whizlabs-promo-code-2024
- https://msnho.com/blog/wp-engine-pricing-plans-2024-it-really-worth-its-price
- https://gitlab.aicrowd.com/-/snippets/185301
- https://web-hosting-coupon.hashnode.dev/wp-engine-coupons
- https://community.soundcore.com/t/wp-engine-coupons-promo-codes-get-50-off-today-2024/9412022
- https://anil.podia.com/wp-engine-free-trial
- https://narede.clicrbs.com.br/articles/wp-engine-review-2024-is-it-worth-the-cost
- https://wpengine-pricing-plans.mystrikingly.com/
- https://web-hosting-coupons.bandcamp.com/album/wp-engine-free-trial
- https://web-hosting-coupon.hashnode.dev/liquid-web-coupon
- https://anil.podia.com/liquid-web-pricing
- https://gitlab.aicrowd.com/-/snippets/192116
- https://medium.com/@anil.27788/liquid-web-affiliate-program-earn-150-or-more-2024-30b80c25bfac
- https://liquidweb-black-friday.weebly.com/
- https://www.geocities.ws/liquid-web-vs-aws/
- https://liquid-web-vs-vps.mystrikingly.com/
- https://start.me/p/5kyaR0/liquid-web-review-2024
- https://web-hosting-coupons.bandcamp.com/album/liquid-web-pricing-2024
- https://web-hosting-coupon.hashnode.dev/datacamp-coupons
- https://datacamp-student-discount.weebly.com/
- https://www.geocities.ws/datacamp-free-trial/
- https://medium.com/@anil.27788/datacamp-pricing-is-a-datacamp-subscription-worth-it-b541db2e2db5
- https://heylink.me/Datacamp-Coupons
- https://anil.podia.com/datacamp-review
- https://narede.clicrbs.com.br/articles/datacamp-vs-udemy-which-one-is-better
- https://datacamp-free-trial.mystrikingly.com/
- https://web-hosting-coupons.bandcamp.com/album/datacamp-student-discount
- https://medium.com/@anil.27788/appsumo-plus-discount-code-get-29-off-coupon-70d8492dd143
- https://www.geocities.ws/appsumo-student-discounts/
- https://anil.podia.com/appsumo-coupon-code
- https://linktr.ee/appsumo_coupons
- https://community.soundcore.com/t/appsumo-discount-coupon-2024-save-10-with-5-deals/9409222
- https://www.geocities.ws/udacity-coupons/
- https://anil.podia.com/udacity-discount-code
- https://udacity-coupons.mystrikingly.com/
- https://narede.clicrbs.com.br/articles/udacity-review-is-udacity-worth-the-money
- https://web-hosting-coupons.bandcamp.com/album/udacity-review
- https://start.me/p/zpaPxn/udacity-reviews-2024
- https://gitlab.aicrowd.com/-/snippets/187656
- https://medium.com/@anil.27788/pluralsight-pricing-how-much-does-pluralsight-cost-2024-320131c4bd1d
- https://www.geocities.ws/pluralsight-vs-coursera/
- https://linktr.ee/pluralsight_coupon_codes
- https://anil.podia.com/pluralsight-free-trial
- https://hackmd.io/@nzjow69/pluralsight-discount-coupon
- https://pluralsight-student-discount.mystrikingly.com/
- https://www.ticketleap.events/tickets/pluralsights/pluralsight-coupons
- https://pluralsight.bandcamp.com/album/pluralsight-coupons-2024-get-63-discount-code
- https://start.me/p/DaElpz/start-page
- https://narede.clicrbs.com.br/articles/pluralsight-coupons-2024-75-discount
- https://sketchfab.com/3d-models/pluralsight-coupon-code-2024-get-upto-70-off-fbe50fb401474fdc92e1cda384a14f70
- https://linktr.ee/pluralsight_coupon
- https://anil.podia.com/nexcess-reviews
- https://medium.com/@anil.27788/nexcess-vs-liquid-web-where-to-host-your-site-aa6b3766b1c4
- https://nexcess-vs-cloudways.weebly.com/
- https://www.geocities.ws/nexcess-vs-bluehost/
- https://linktr.ee/nexcess_coupon_codes
- https://nexcess-pricing.mystrikingly.com/
- https://nexcessreview.bandcamp.com/album/nexcess-reviews-is-it-worth-it
- https://start.me/p/mwXQRY/nexcess-vs-liquid-web
- https://narede.clicrbs.com.br/articles/mindvalley-discount-coupons
- https://medium.com/@upwritez/mindvalley-discount-code-2024-100-off-coupon-01d7418f8cb9
- https://start.me/p/QLMa2O/mindvalley-discounts
- https://jason57.podia.com/mindvalley-discount-code
- https://www.geocities.ws/mindvalley-discount-promo/
- https://mindvalley-coupon.bandcamp.com/album/mindvalley-coupons-2024-get-latest-88-discount
- https://medium.com/@anil.27788/mindvalley-coupons-flat-40-off-june-2024-cf38c05b3f6b
- https://www.geocities.ws/mindvalley-free-trial/
- https://mindvalleyvsmasterclass.bandcamp.com/album/mindvalley-vs-masterclass-comparison-guide-for-2024
- https://www.artstation.com/williamjones2357u/profile
- https://linktr.ee/mindvalley_discount
- https://www.storeboard.com/mindvalleydiscountcoupons2024
Frequently Asked Questions
What is the best tool for monitoring?
Prometheus is one of the best open-source monitoring tools for your servers. It has amazing features like Highly efficient and advanced data dimensional mode, a series of key-value pairs, users extracting and managing data, generating graphs and charts, an inbuilt browser: Grafana, and much more. All these features keep you intact with the tool.
Does NetXMS cost money?
No, NetXMS is a free monitoring service to use, and you can monitor your IT server easily with this. You can use it to monitor the health and performance of your network devices and open source server management. NetXMS is known for its flexibility and ability to scale to meet the needs of both small and large networks.
Can I get OpenNMS for free?
Yes, you can use the free trial of OpenNMS. But the free version has limited features, and if you want to extend the features, then you must choose any suitable subscription plan. OpenNMS can automatically discover network devices and services on your network. Event and Alarm Management features can capture and correlate events from various sources.
Are all SNMP tools open source?
Not all SNMP tools are open source. But the good news is that you can use some of them to fit your needs. It is an application layer protocol that facilitates the exchange of management and monitoring information between network devices, such as routers, switches, servers, and network-attached devices.
How can I watch my network traffic using open-source tools?
You can follow the steps that I am going to mention here to monitor network traffic with open-source tools. First thing First, choose the tool you want. Then, open its dashboard and connect it to your servers to start tracking the traffic.
What are the advantages of using open-source monitoring tools?
Let’s talk about the advantages in brief. They offer free-to-use platforms and are cost-effective to businesses. The availability of source code allows for customization and flexibility. Open-source technologies benefit from a large and active development community. They get continuous updates, enhancements, and a wealth of available information.
Do open-source monitoring tools have the capacity to manage extensive environments?
Yes, open-source monitoring tools can handle large-scale environments, offering scalability and adaptability that allow organizations to efficiently monitor numerous devices, systems, and applications. There are some monitoring tools that may not be useful for large-scale environments, but most of them are. In fact, a lot of well-known big organizations use Observium as their monitoring tool.
